Will gold prices surge on rising demand and a first 2025 Fed cut?
 According to analysts, gold prices are likely to remain on an upward path, supported by record ETF inflows, tariff-driven inflation pressures, and the Federal Reserve’s first rate cut of 2025. While a short-term pause is possible due to profit-taking and dollar strength, the structural drivers of demand point to higher prices over the medium term.
Key takeaways
US gold ETF assets have doubled in two years, reaching $215 billion, after adding 279 tonnes of gold in 2025.
- Spot gold trades near $3,700, with investors watching the $3,800 price level.
- Tariffs filtering into consumer prices are expected to fuel inflation, historically a strong driver of gold demand.
- The Fed is expected to deliver its first rate cut since January, reducing real yields and supporting non-yielding assets.
- Risks include speculative over-positioning, dollar strength, and uncertainty around Fed forward guidance.
Gold ETF demand is surging
Gold demand is surging, and US ETFs are leading the way. As of September 2025, US gold ETFs hold $215 billion in assets under management, more than the combined $199 billion in European and Asian ETFs. Year-to-date inflows of 279 tonnes underline the scale of demand.
According to analysts, gold prices are likely to remain on an upward path, supported by record ETF inflows, tariff-driven inflation pressures, and the Federal Reserve’s first rate cut of 2025. While a short-term pause is possible due to profit-taking and dollar strength, the structural drivers of demand point to higher prices over the medium term.
Key takeaways
US gold ETF assets have doubled in two years, reaching $215 billion, after adding 279 tonnes of gold in 2025.
- Spot gold trades near $3,700, with investors watching the $3,800 price level.
- Tariffs filtering into consumer prices are expected to fuel inflation, historically a strong driver of gold demand.
- The Fed is expected to deliver its first rate cut since January, reducing real yields and supporting non-yielding assets.
- Risks include speculative over-positioning, dollar strength, and uncertainty around Fed forward guidance.
Gold ETF demand is surging
Gold demand is surging, and US ETFs are leading the way. As of September 2025, US gold ETFs hold $215 billion in assets under management, more than the combined $199 billion in European and Asian ETFs. Year-to-date inflows of 279 tonnes underline the scale of demand.
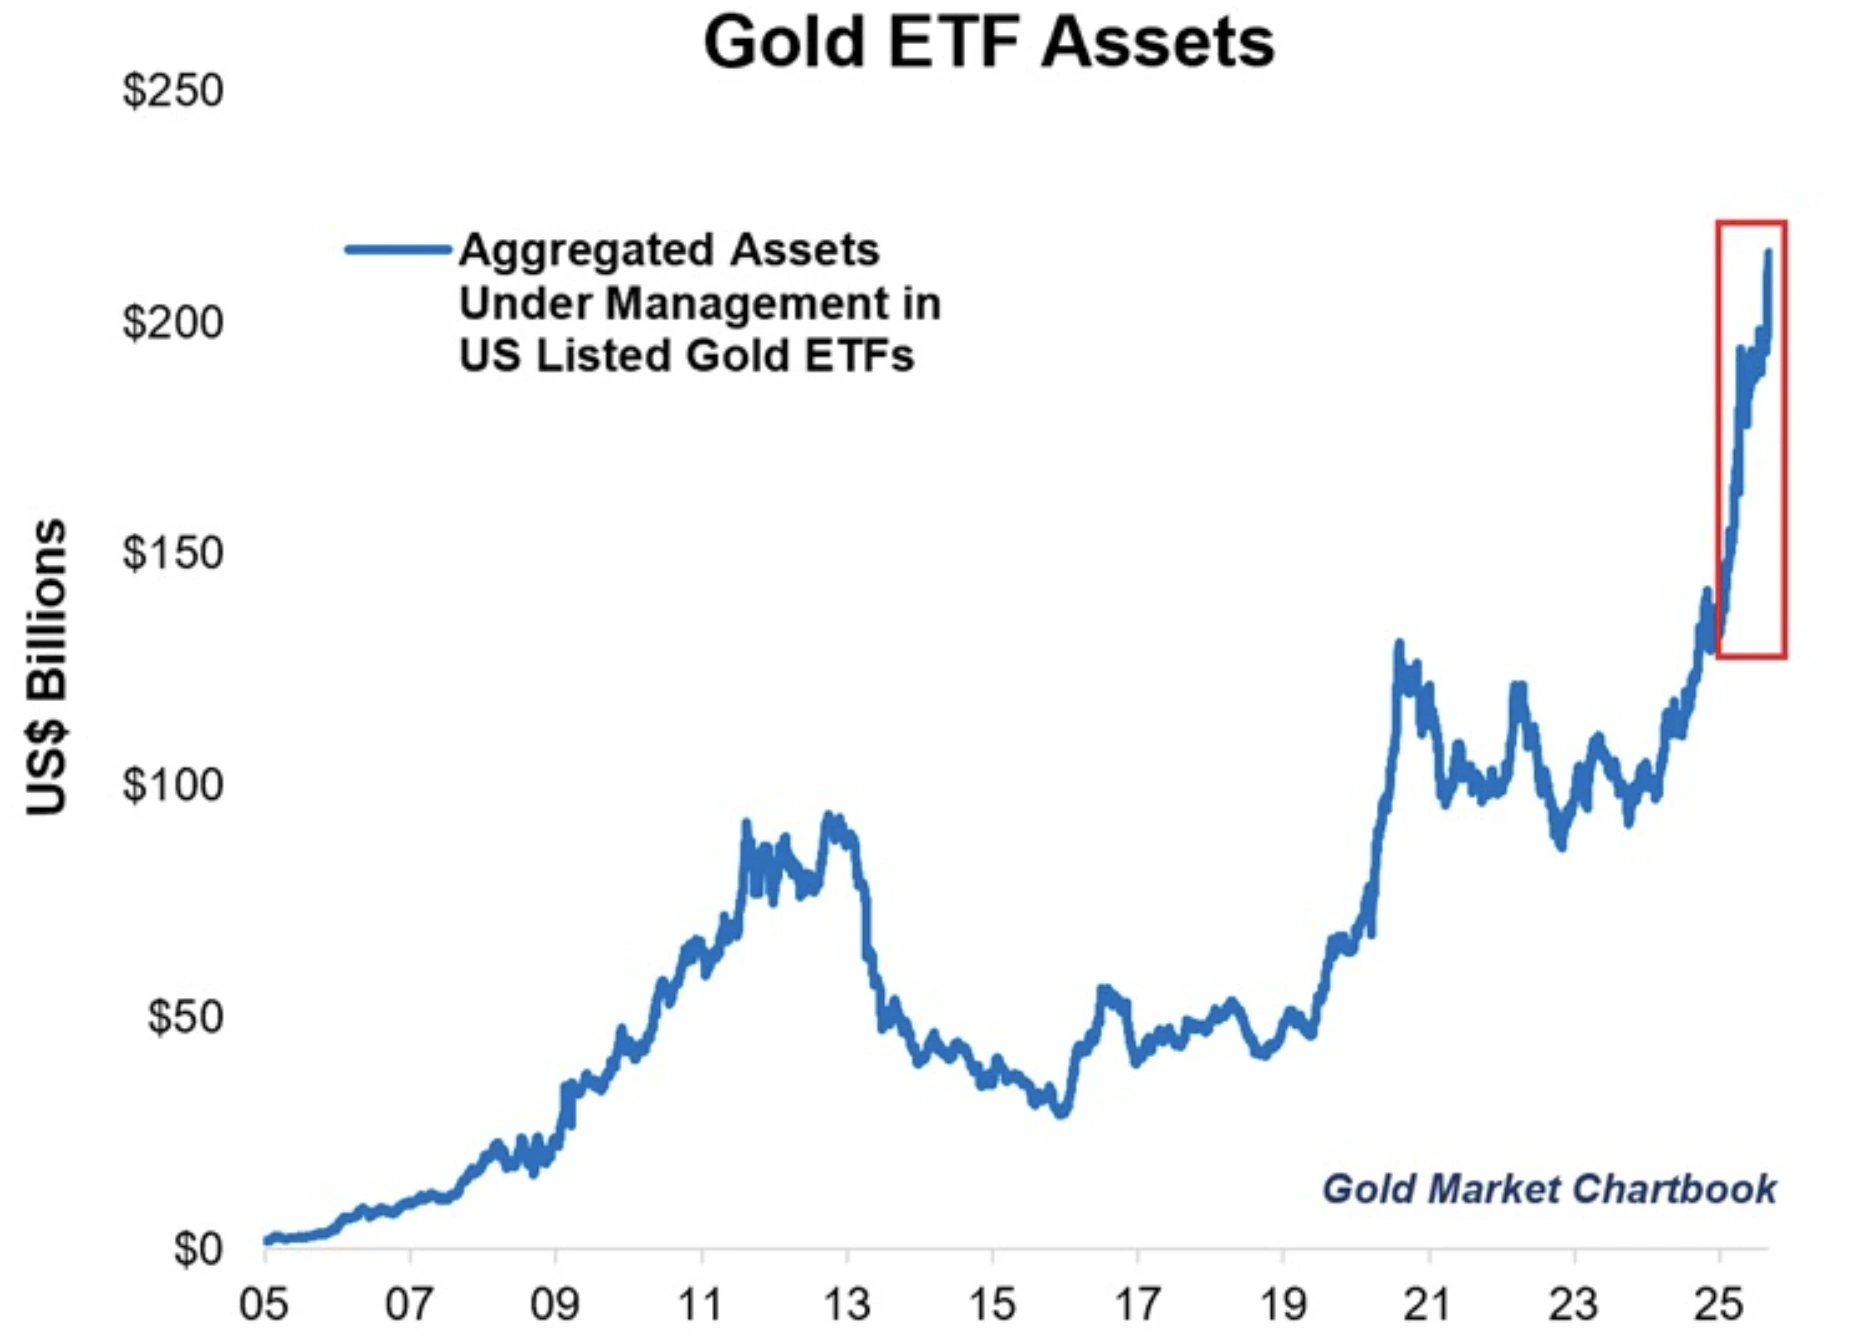 Source: Topdown Charts, LSEG
Major funds illustrate the trend clearly. SPDR Gold Shares (GLD) trades at $338.91 per share; its 52-week low was approximately $235.30 on 18 September 2024, indicating a gain of over 40% over the year.
Source: Topdown Charts, LSEG
Major funds illustrate the trend clearly. SPDR Gold Shares (GLD) trades at $338.91 per share; its 52-week low was approximately $235.30 on 18 September 2024, indicating a gain of over 40% over the year.
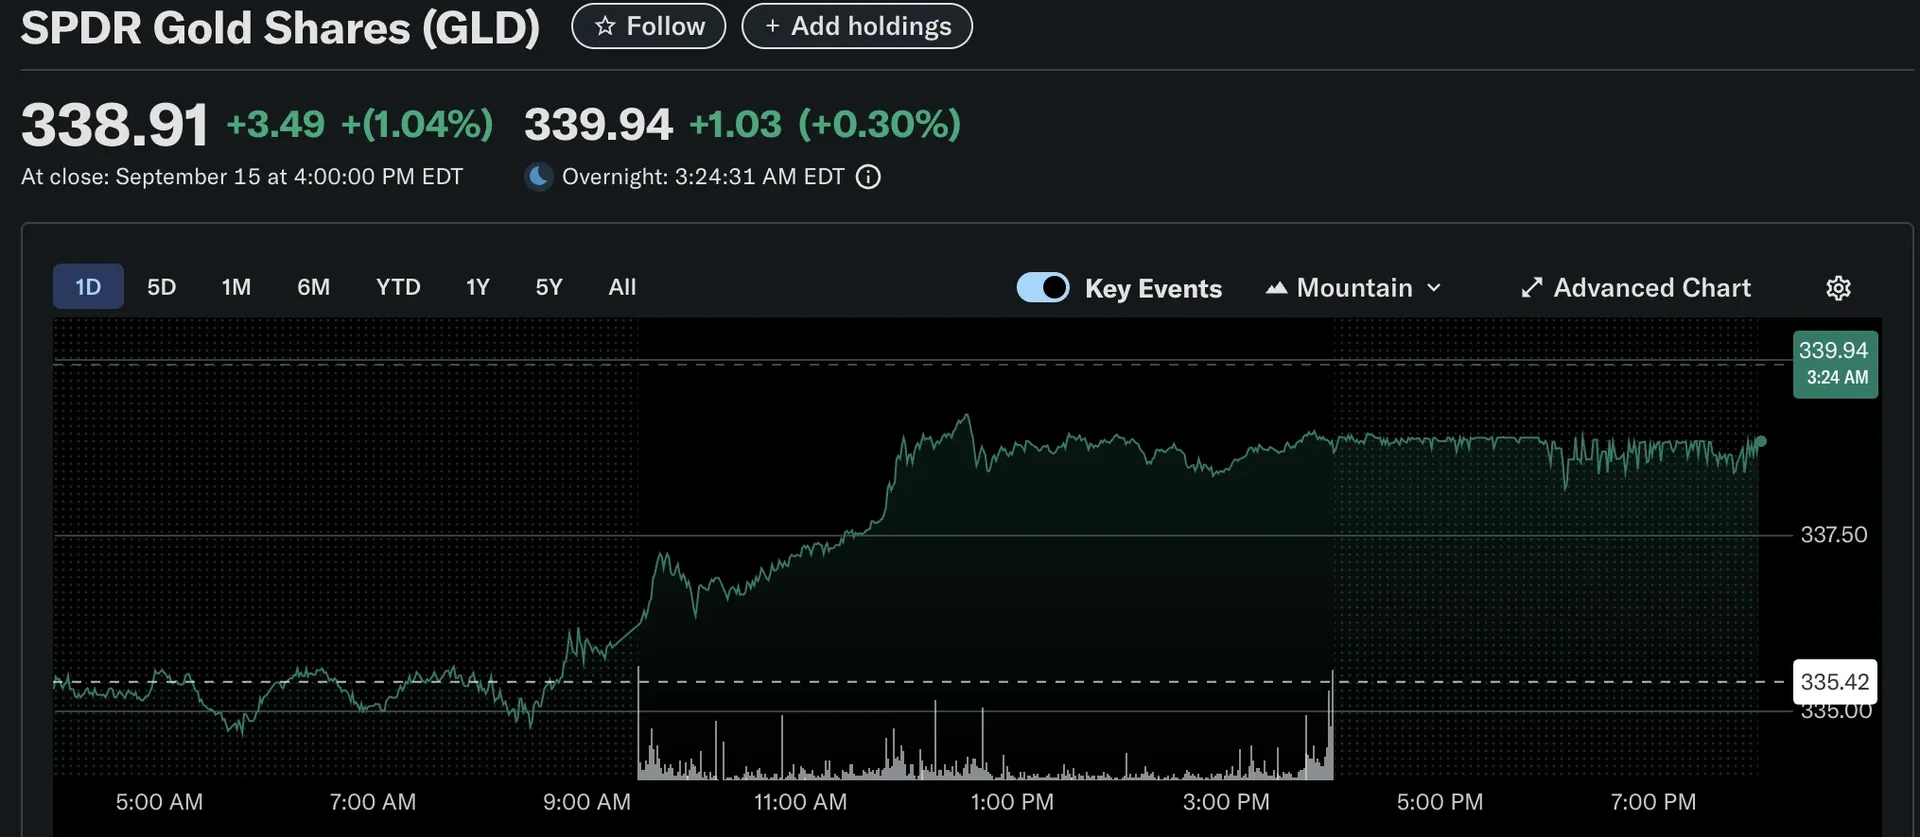 Source: Yahoo Finance
iShares Gold Trust (IAU) shows a similar trajectory at $69.45 per share, a 48.11% year-on-year rise. These gains track the broader rally in gold prices, reinforcing the idea that ETF demand is both reflecting and amplifying the market’s momentum.
Tariffs as an inflation catalyst
One of the less discussed but increasingly important drivers is tariffs. According to Sprott Asset Management strategist Paul Wong, tariffs imposed earlier this year are still working through supply chains. As post-tariff inventories reach consumers, the cost of goods is expected to rise.
That inflationary impulse plays directly into gold’s traditional role as a hedge against purchasing power erosion. If inflation accelerates at the same time as the Fed cuts rates, real interest rates will decline sharply, creating one of the most supportive backdrops for gold since the 1970s. Sprott describes this as a “debasement trade” - where currency weakness and inflation combine to drive flows into hard assets like gold.
US Federal Reserve rate cut in mid-September
The Federal Reserve is expected to cut rates by 25 basis points this week. Lower interest rates reduce the opportunity cost of holding gold, while persistent inflation strengthens its appeal. Markets are also pricing in rate reductions continuing into 2026 to stave off recession risk.
But there is an added complication: political interference. President Trump has repeatedly pressured the Fed to deliver deeper cuts and exerted influence over its broader role. His attacks on Fed independence have created institutional uncertainty, a factor that historically pushes investors toward safe-haven assets.
Risks of a pullback on gold
The bullish outlook for gold remains intact, but tactical pullbacks are possible. The US dollar index edged 0.1% higher this week, making dollar-priced bullion more expensive for overseas buyers. Speculators also reduced their net long positions by 2,445 contracts to 166,417 as of 9 September, signalling profit-taking.
KCM Trade analyst Tim Waterer noted that “a period of consolidation or a minor pullback would arguably be a healthy outcome that supports gold’s ambitions for hitting loftier price targets down the road.”
Market impact and outlook on gold
Gold’s medium-term trajectory remains positive. Goldman Sachs maintains a $4,000 per ounce target for mid-2026, arguing that the risks are skewed to the upside. Strong ETF demand, tariff-driven inflation, and the likelihood of declining real yields all reinforce this view.
Global dynamics further support gold’s position. Central banks have been steadily increasing their bullion reserves, diversifying away from the dollar in a bid to strengthen their balance sheets. This accumulation highlights gold’s enduring role as a neutral reserve asset at a time when the dollar’s dominance faces challenges from both inflation and geopolitical pressures.
Gold price technical analysis
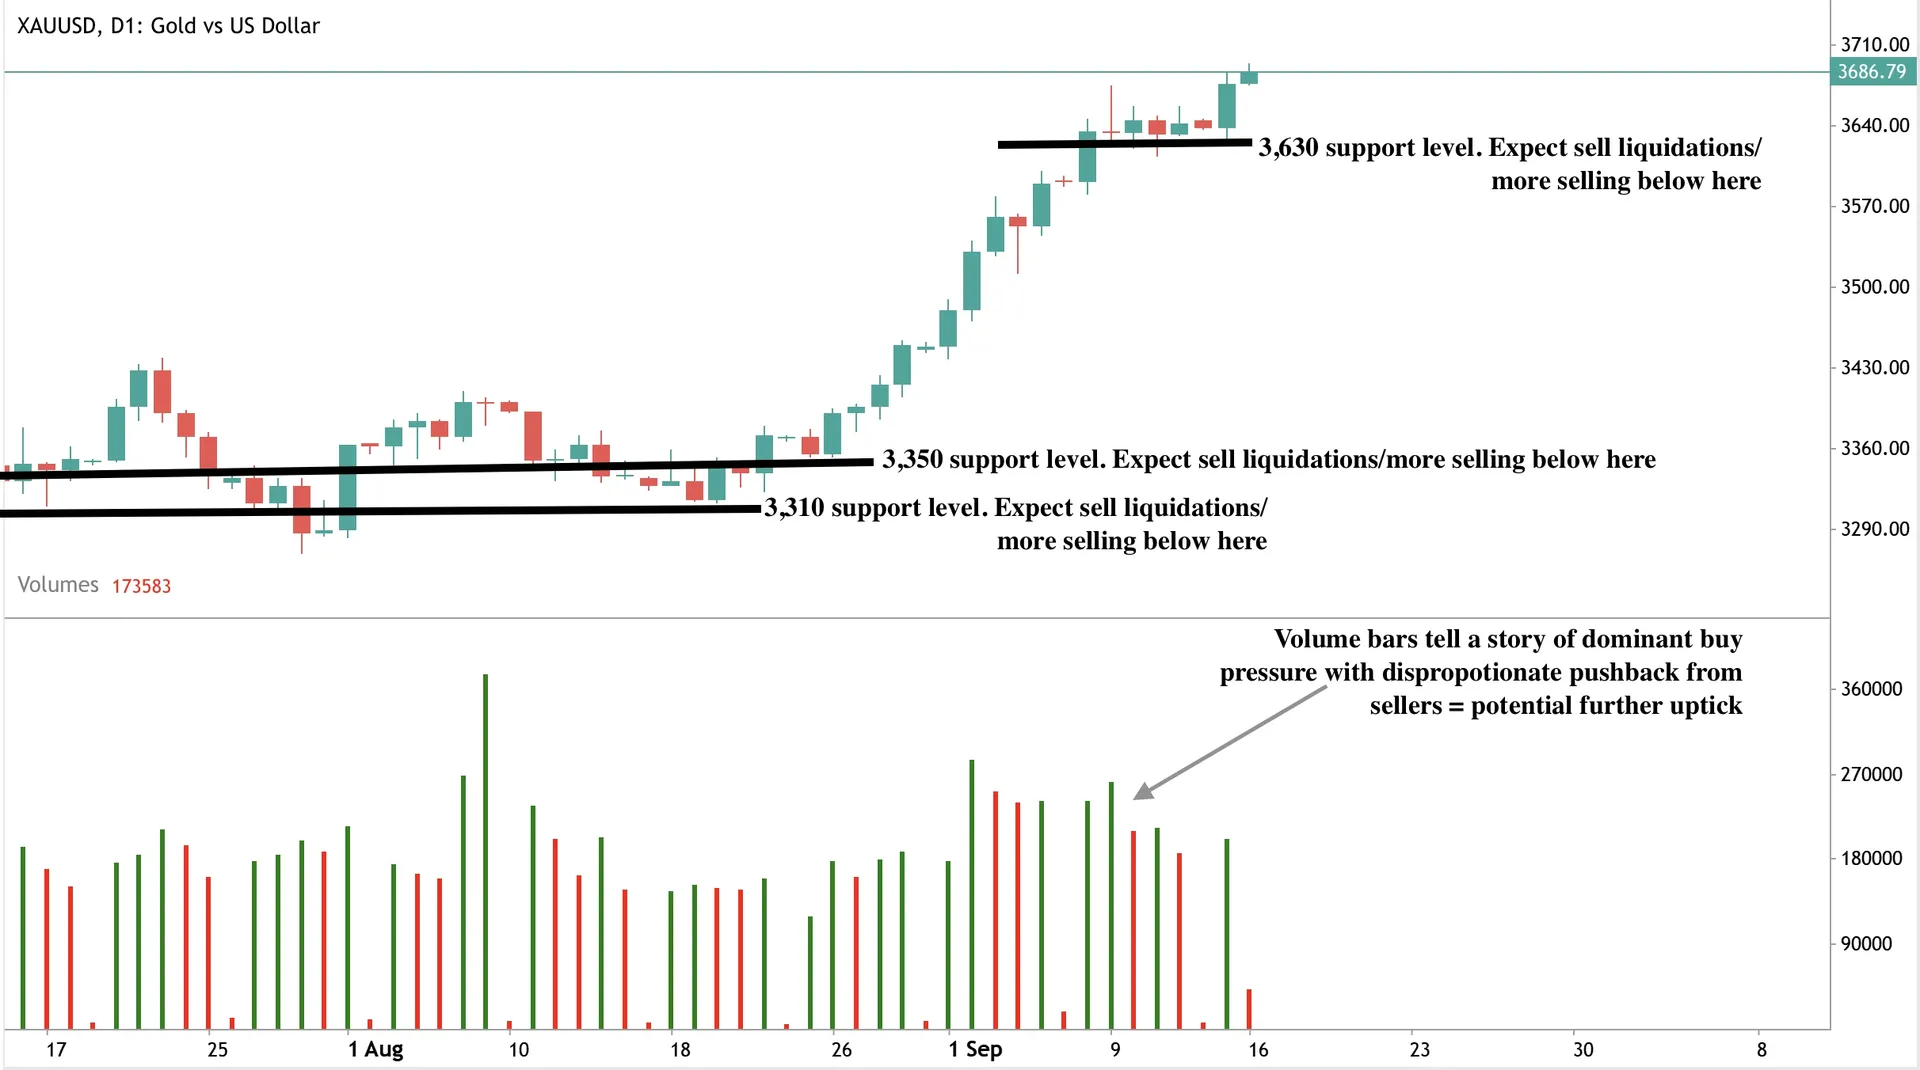
At the time of writing, Gold is surging, with bullish pressure evident on the daily chart and on the volume bars. Sellers are not pushing with enough conviction. If buyers advance further, they could breach the $3,800 price level. Conversely, if we see a dip, prices could test the $3,630 support level, with further support levels lying in the $3,550 and $3,310 price levels.
Source: Yahoo Finance
iShares Gold Trust (IAU) shows a similar trajectory at $69.45 per share, a 48.11% year-on-year rise. These gains track the broader rally in gold prices, reinforcing the idea that ETF demand is both reflecting and amplifying the market’s momentum.
Tariffs as an inflation catalyst
One of the less discussed but increasingly important drivers is tariffs. According to Sprott Asset Management strategist Paul Wong, tariffs imposed earlier this year are still working through supply chains. As post-tariff inventories reach consumers, the cost of goods is expected to rise.
That inflationary impulse plays directly into gold’s traditional role as a hedge against purchasing power erosion. If inflation accelerates at the same time as the Fed cuts rates, real interest rates will decline sharply, creating one of the most supportive backdrops for gold since the 1970s. Sprott describes this as a “debasement trade” - where currency weakness and inflation combine to drive flows into hard assets like gold.
US Federal Reserve rate cut in mid-September
The Federal Reserve is expected to cut rates by 25 basis points this week. Lower interest rates reduce the opportunity cost of holding gold, while persistent inflation strengthens its appeal. Markets are also pricing in rate reductions continuing into 2026 to stave off recession risk.
But there is an added complication: political interference. President Trump has repeatedly pressured the Fed to deliver deeper cuts and exerted influence over its broader role. His attacks on Fed independence have created institutional uncertainty, a factor that historically pushes investors toward safe-haven assets.
Risks of a pullback on gold
The bullish outlook for gold remains intact, but tactical pullbacks are possible. The US dollar index edged 0.1% higher this week, making dollar-priced bullion more expensive for overseas buyers. Speculators also reduced their net long positions by 2,445 contracts to 166,417 as of 9 September, signalling profit-taking.
KCM Trade analyst Tim Waterer noted that “a period of consolidation or a minor pullback would arguably be a healthy outcome that supports gold’s ambitions for hitting loftier price targets down the road.”
Market impact and outlook on gold
Gold’s medium-term trajectory remains positive. Goldman Sachs maintains a $4,000 per ounce target for mid-2026, arguing that the risks are skewed to the upside. Strong ETF demand, tariff-driven inflation, and the likelihood of declining real yields all reinforce this view.
Global dynamics further support gold’s position. Central banks have been steadily increasing their bullion reserves, diversifying away from the dollar in a bid to strengthen their balance sheets. This accumulation highlights gold’s enduring role as a neutral reserve asset at a time when the dollar’s dominance faces challenges from both inflation and geopolitical pressures.
Gold price technical analysis
At the time of writing, Gold is surging, with bullish pressure evident on the daily chart and on the volume bars. Sellers are not pushing with enough conviction. If buyers advance further, they could breach the $3,800 price level. Conversely, if we see a dip, prices could test the $3,630 support level, with further support levels lying in the $3,550 and $3,310 price levels.
 Gold investment implications ahead of Fed
For investors, the setup remains bullish. Over the medium term, the convergence of ETF demand, tariff-fuelled inflation, and Fed rate cuts presents one of the strongest environments for gold in decades. With central banks reinforcing the demand story, gold remains a critical allocation for portfolios seeking protection against inflation and policy uncertainty.
Gold investment implications ahead of Fed
For investors, the setup remains bullish. Over the medium term, the convergence of ETF demand, tariff-fuelled inflation, and Fed rate cuts presents one of the strongest environments for gold in decades. With central banks reinforcing the demand story, gold remains a critical allocation for portfolios seeking protection against inflation and policy uncertainty.Disclaimer:
The information contained within this article is for educational purposes only and is not intended as financial or investment advice. It is considered accurate and correct at the date of publication. Changes in circumstances after the time of publication may impact the accuracy of the information. The performance figures quoted refer to the past, and past performance is not a guarantee of future performance or a reliable guide to future performance. No representation or warranty is given as to the accuracy or completeness of this information. Do your own research before making any trading decisions.
Publication date:
2025-09-18 11:42:07 (GMT)